Introduction
In 2021, the SASB Standards Board made Diversity, Equity & Inclusion (DEI) a priority Human Capital topic for standards revision.1 In this update, we discuss the findings of the Data for Good Scholars (DfG) team to identify material practices related to DEI by applying our methodologies to FactSet’s TruValue SASB Spotlight Events (TVL) dataset and Form 10-Ks. These sources and methods are described in the February 2022 Update.
Our two-pronged objective is to find supporting evidence for extending existing DEI metrics to industry standards that do not currently contain them (Extension Workstream) and for defining new metrics for human rights-related business risks (Addition Workstream). For the former, we assess the prevalence of DEI events by industry. We consider the number of companies reporting financially material DEI practices, as well as how often those financial impacts and risks are being reported in TVL reports and Form 10-Ks among industries not yet proposed for DEI standard-setting. For the Addition Workstream, we use our data sources and our heuristic method to assess the relationship between practices and outcomes by industry. We achieved 90% accuracy in returns of content discussing financially material DEI practices from our data sources.
In applying our heuristic method to TVL reports and Form 10-Ks, we found evidence to support the extension of DEI standard-setting to a total of 16 industries (seven from evidence in TVL reports and 13 from evidence in Form 10-Ks) beyond the 45 that SASB researchers proposed. Among the 16, the evidence that DEI is material across the two data sources converge for the following four industries: Building Products & Furnishings; Oil & Gas—Services; Rail Transportation; and Security & Commodity Exchange. Further, we find hiring/recruitment, employee training, and DEI “programs” to be the DEI practices most frequently tied to financially material outcomes across industries.
Below we discuss first the findings from our Extension Workstream and then provide an advance look at what is emerging from the Addition Workstream. Within each workstream, we present the results from the application of our heuristic to our two data sources — TVL and Form 10-Ks — separately. Since the scope and attributes of each source are distinct, separate analysis helps us to see what might account for corroborating or divergent findings across the sources.
A public repository of our code and keyword dictionaries is available on Github at this link.
The fall 2021 data team was comprised of Isha Shah (Coordinator), Raiha Khan, Sabrina Jade Shih, Jay Trevino, and Junyi Zhang. Raiha Khan is the lead writer of this update. The DfG work is led by Rights CoLab Co-Founders Joanne Bauer and Paul Rissman who, together with the Expert Group, guide the project. DfG Program Coordinator Dr. Ipek Ensari supervises the data science methods selection and implementation. Meagan Barrera, a consultant, conducted a literature review to augment our list of terms, and Mark Filipovic produced the report.
Extension Workstream Findings
In 2021, SASB launched a standard-setting project on Diversity, Equity & Inclusion to take a fresh look at why and how the topic impacts long-term enterprise value creation on an industry-specific basis. According to an EY blog post on the SASB project,
The SASB Human Capital: Diversity & Inclusion standard-setting project is an important development in DEI disclosure. While investors, regulators and companies have been striving to improve transparency about DEI matters, the SASB project contributes to the conversation by aiming to understand why and how DEI is relevant to a particular business model.2
At its December 2021 meeting, the SASB Standards Board approved an approach for defining financially material DEI topics across industry standards. Based on a review of academic literature, consultations with market actors, and other evidence, SASB researchers identified four “channels of business relevance” (see Figure 1):
-
- Talent Attraction & Retention
- Product Design, Marketing & Delivery
- Community Relations
- Innovation & Risk Recognition
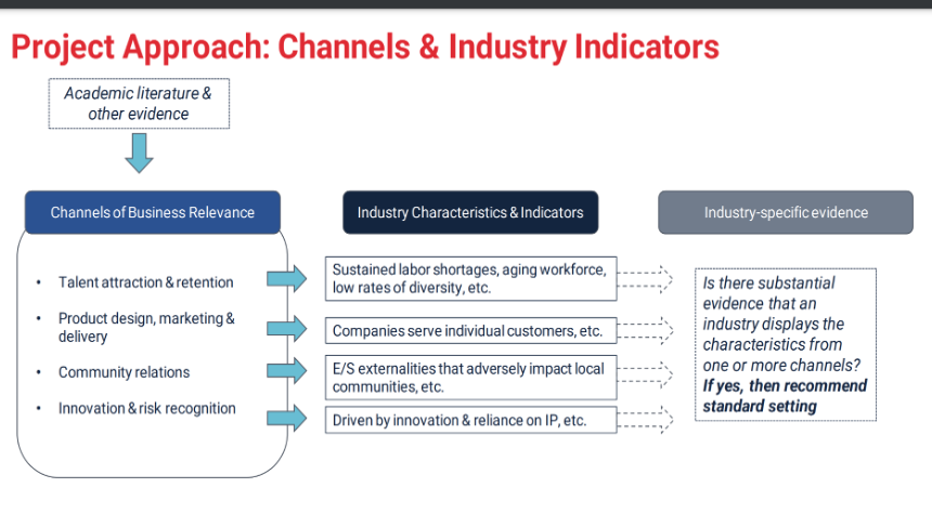
Figure 1: Channels and industry indicators. Source: Value Reporting Foundation.3
Using this framework, the SASB Standards research team preliminarily identified 45 additional industries for DEI standard-setting. Figure 2 indicates those industry standards that currently have a DEI metric (in pink), the 45 industries proposed for DEI standard-setting (in red), and the industries without a DEI disclosure metric that have not been proposed for DEI standard-setting (in black). The pink industries are our “benchmark” DEI industries, whereas the black industries are our “non-benchmark” DEI industries.
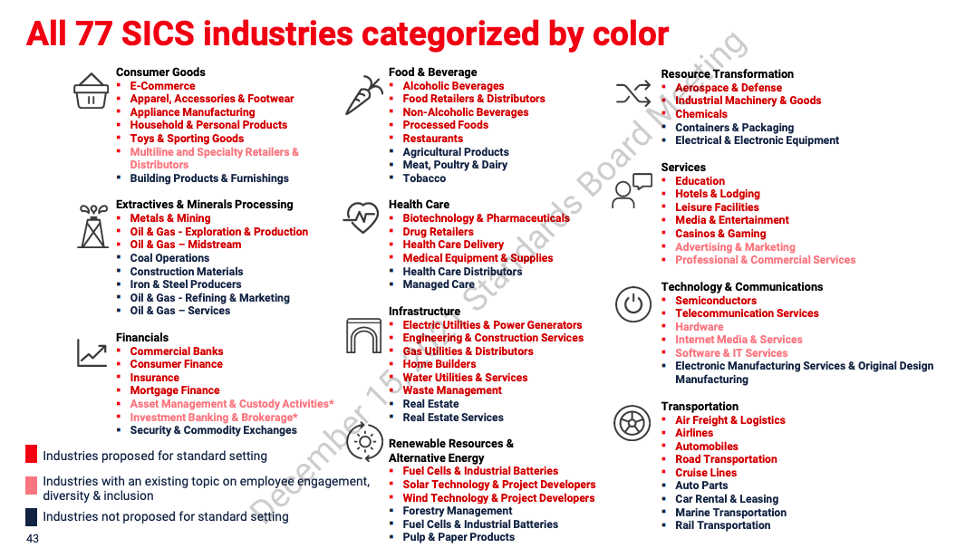
Figure 2: All 77 Sustainable Industry Classification System (SICS) industries categorized by color. Source: Value Reporting Foundation.4
As described in the February 2022 Update, our DEI heuristic and term dictionaries are based on the “gender/race representation” metric in the current SASB standards.5 It is the most prevalent of the seven diversity and inclusion metrics within the industry standards. Moreover, we observed that other diversity and inclusion metrics in the current standard pertain to practices that are not typically regarded as being about diversity and inclusion. For example, the standard for the Biotechnology and Pharmaceutical industry includes “Discussion of talent recruitment and retention efforts for scientists and research and development personnel.” The semiconductors standard asks only for the “Percentage of employees that are (1) foreign nationals and (2) located offshore.” Only one other DEI metric besides “gender/race representation” reflects diversity and inclusion as it is commonly treated in the market: “Total amount of monetary losses as a result of legal proceedings associated with employment discrimination.” In fact, the eight industry standards that SASB researchers designated as having an existing topic are all industries that have the “gender/race representation” metric. Despite there being nine industry standards with this metric, SASB researchers determined that the total number of industries with an existing standard is eight, as it concluded that the metrics for the ninth – E-Commerce – require further study and therefore new DEI standard setting as part of the current project.
From the perspective of data science, it is both noteworthy and relevant that SASB researchers have renamed the topic from “Employee Engagement, Diversity & Inclusion” (EDI) to “Diversity, Equity & Inclusion” (DEI), to align with the terminology now widely used by market actors. This change in terminology has implications for data science as it requires that we adjust our keyword dictionaries to ensure that “equity,” “equitable,” and synonyms are captured.
Our Form 10-K dataset covers the years 2016–2021, providing insight into how often DEI risks are self-reported by U.S.-domiciled companies in their financial filings. Our TVL dataset consists of “unstructured data in over 13 different languages from over 100,000 sources, such as news, government agencies, NGOs, and more.”6 We used it to discover how often financially material DEI risks or opportunities are flagged in these reports. Because the dataset includes all companies domiciled anywhere in the world, it provides a valuable global perspective on DEI practices by industry.
Below we provide a comparison of the frequency of DEI-reported risks or opportunities for benchmark and non-benchmark industries as evidence that DEI may be material to certain industry standards that do not currently have an existing or proposed DEI indicator. Applying our heuristic to Form 10-Ks turns up evidence to support the case for considering standard-setting for 13 industries that do not have a current or proposed DEI standard, whereas applying it to third-party reporting captured in our TVL dataset turns up support for 7 of the 24 industries. The difference may be because financially material DEI is not always captured by third-party reporting, even as companies recognize the risk. Moreover, recent upticks in company reporting likely reflect the 2020 changes in the SEC’s reporting requirements that aim to modernize human capital disclosure standards.7
As we expand our DEI term dictionaries to account for the four proposed channels, we expect to identify more industries for DEI standard-setting.
The number of companies reported to have financially material DEI events is steadily increasing
Our analysis of reports from our TVL dataset spanning 2016 to 2021 shows that the number of companies linked to financially relevant workplace DEI events has increased steadily since 2016. Figure 3 shows the company count by industry that we identified as having experienced material DEI-related events. We found 159 companies identified in articles about DEI in a financially material context in 2020, as compared to 35 companies in 2016 — more than a four-fold increase. These findings point to a long-term trend that is likely to continue.
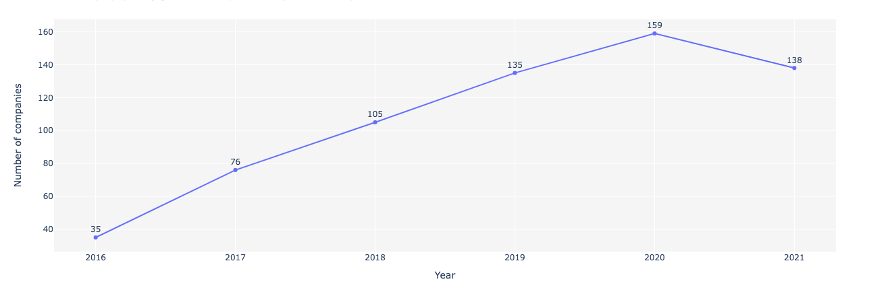
Figure 3: Yearly counts of companies with financially material DEI practices, based on co-occurrence search in TVL reports. Source: TVL (Employee Engagement, Diversity & Inclusion), Jan. 2016–Sep. 2021.
Seven industries not proposed for DEI standard-setting exceed benchmark levels of reported financially material DEI events
In applying our heuristic methods to TVL reports using our DEI term dictionaries based on the “gender/race representation” metric, we note some smaller industries with an existing or proposed DEI metric for standard-setting that have only one or two companies linked to financially material DEI events . For example, we identified only two companies in Advertising & Marketing as compared to 37 companies in Multiline and Specialty Retailers & Distributors, both industries with the DEI disclosure topic in the existing SASB Standard. Among proposed industries, we found eight with just one such company compared to 27 in Media & Entertainment.
To account for the difference in industry size, we adopted a ubiquity measure for each industry — or the proportion of companies linked to a financially material DEI practice by industry. The ubiquity measure also helps us to account for the differences in media coverage across industries, where some industries may be more under-the-radar than others. When adjusted for the total number of companies within industries, the top ubiquity measure found for industries in our TVL data set is 19.29% in Media & Entertainment. By comparison, the ubiquity measures for industries with the DEI disclosure topic in the current standards range from 3.51% of companies (Advertising & Marketing) to 13.53% of companies (Internet Media & Services). Proposed industries have a broader range of ubiquity measures, from as low as 0.34% in Medical Equipment & Supplies to 19.29% in Media & Entertainment.
As shown in Figure 4, we turned up evidence of the financial materiality of DEI practices in 17 new industries not included in SASB’s proposed list for standard-setting (black bars). To make sense of which industries present the highest levels of material DEI reporting according to our co-occurrence search across TVL reports, we use the median of all ubiquity measures for the 53 industries with existing (8 industries) or proposed (45 industries) DEI standard-setting to identify potential industries for further DEI standard-setting. This benchmark — 4.7% of industry companies — tells us that any industry with at least 4.7% of companies having material DEI reporting should also be considered for DEI standard-setting.
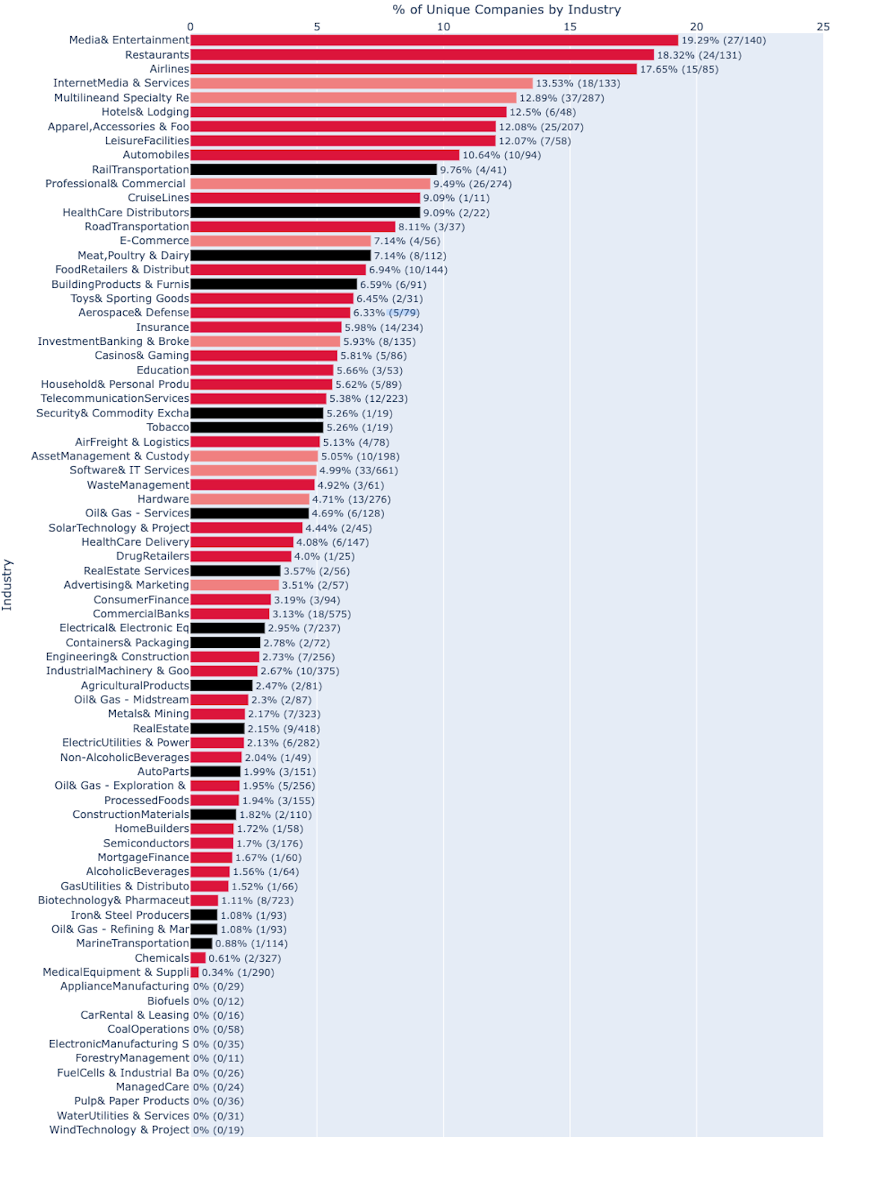

Figure 4: Shares of companies with financially material DEI events by industry. Source: FactSet TruValue Labs SASB Spotlight Events (EDI: Jan. 2016–Sep. 2021).
Using this criterion, we found that 7 out of 24 industries that neither have an existing standard nor have been proposed for the standard-setting exceed this benchmark. They are as follows:
-
- Rail Transportation
- Health Care Distributors
- Meat, Poultry & Dairy
- Building Products & Furnishings
- Security & Commodity Exchange
- Tobacco
- Oil & Gas—Services
The ubiquity criterion allows us to reconcile differences in industry coverage within our TVL corpus. As such, among these 7 industries, some — such as Security & Commodity Exchange and Tobacco — have as few as 19 companies connected to DEI-related events, whereas Meat, Poultry & Dairy has 112 such companies.
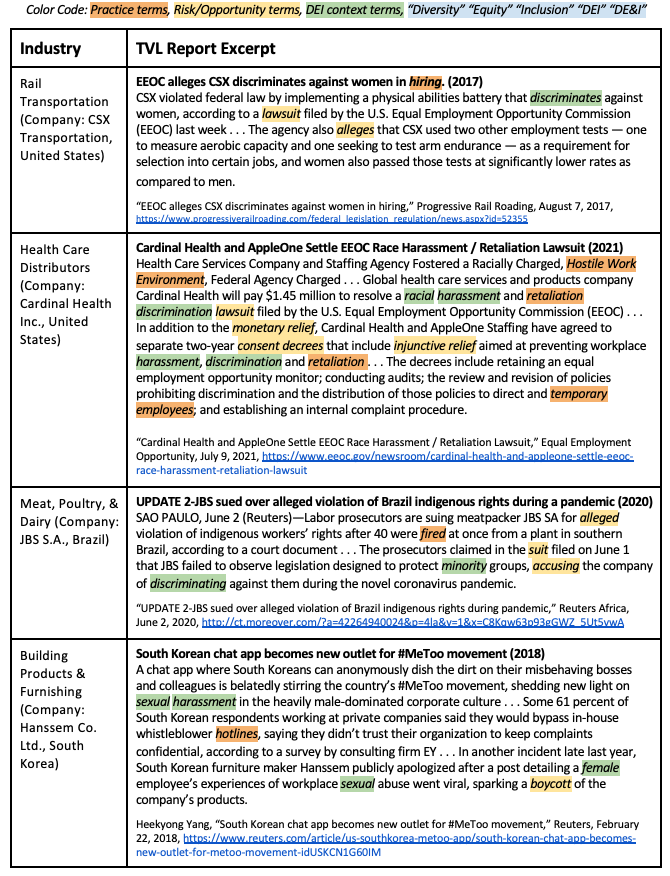
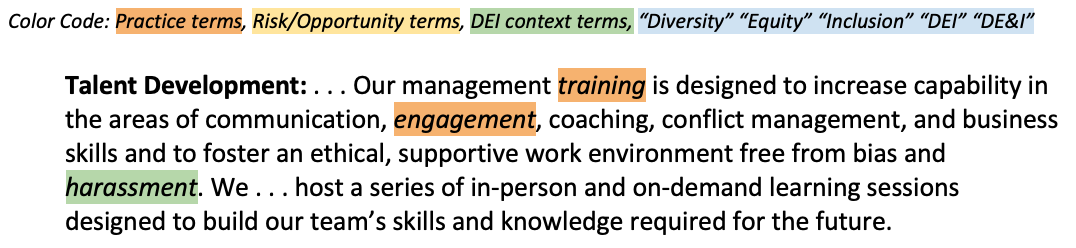
Excerpts of TVL reports that cite a material DEI event connected to a company from four of these seven industries are provided in Table 1. These industries exceed our ubiquity criterion. Our heuristic method flagged the articles by the highlighted terms (type of term indicated by the color code).
Table 1: Material DEI Events in Industries Not Yet Identified for DEI Standard-Setting
Companies are reporting on the financial risks of DEI practices in their Form 10-Ks with greater frequency
As with our findings from the TVL dataset, in applying our heuristic method to our Form 10-K corpus, we find that the total number of companies with 10-Ks containing DEI practices has increased steadily since 2016, with a spike in the number of companies within the first three months of 2021 (Figure 5). In their 2016 10-Ks, 723 companies mentioned their DEI practices or how they are mitigating potential risks that may arise from negative DEI practices, as compared to 1034 companies in 2020. The spike shown in the first quarter of 2021 likely reflects the rising concern with DEI in 2020 in light of the coronavirus pandemic and the murder of George Floyd. It is also likely influenced by the SEC’s August 2020 rule amendments to modernize disclosures with an increased focus on human capital disclosures that are rooted in materiality.8 Our findings confirm the trend also observed by others that, despite remaining relatively low overall, corporate reporting on DEI practices is on the rise and is likely to continue.9
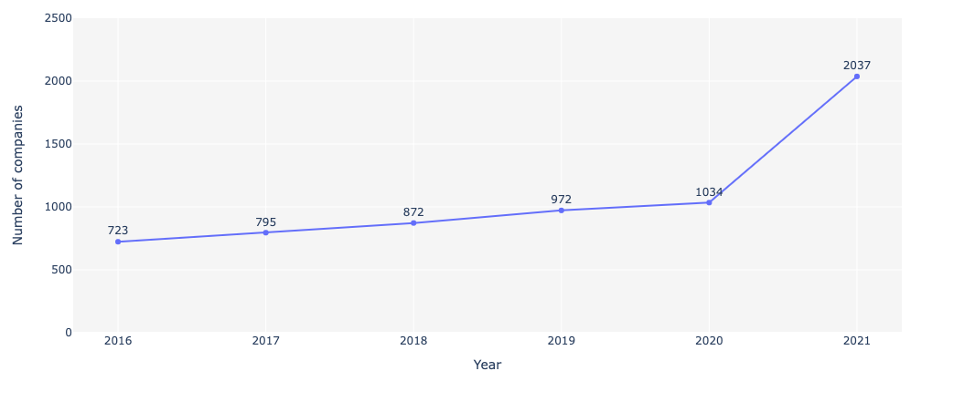
Figure 5: Yearly counts of companies with financially material DEI practices, based on a practice term search within Form 10-Ks. Source: Form 10-Ks, Jan. 2016–Mar. 2021.
13 industries not yet proposed by VRF for DEI standard-setting report on DEI risks in their Form 10-Ks more often than companies required to report
We note a wide range in the number of companies in each industry that self-report material DEI practices. For example, we identified 15 companies in E-Commerce as compared to 258 companies in Software & IT Services, both industries that have the DEI disclosure topic in the existing SASB Standard. Among proposed industries, we found anywhere from two (Drug Retailers) to 335 (Biotechnology & Pharmaceuticals) companies linked to such practices.
As shown in Figure 6, we turned up evidence of the financial materiality of DEI practices, in the context of gender/race representation for all 24 industries not included in SASB’s proposed list of industries for standard-setting (black bars). In applying the same criterion of the median of ubiquity measures for industries with existing or proposed DEI standard-setting to Form 10-K findings (as we applied to findings from TVL reports), we see significant evidence of the financial materiality of DEI, where the median ubiquity measure is 50% of industry companies.
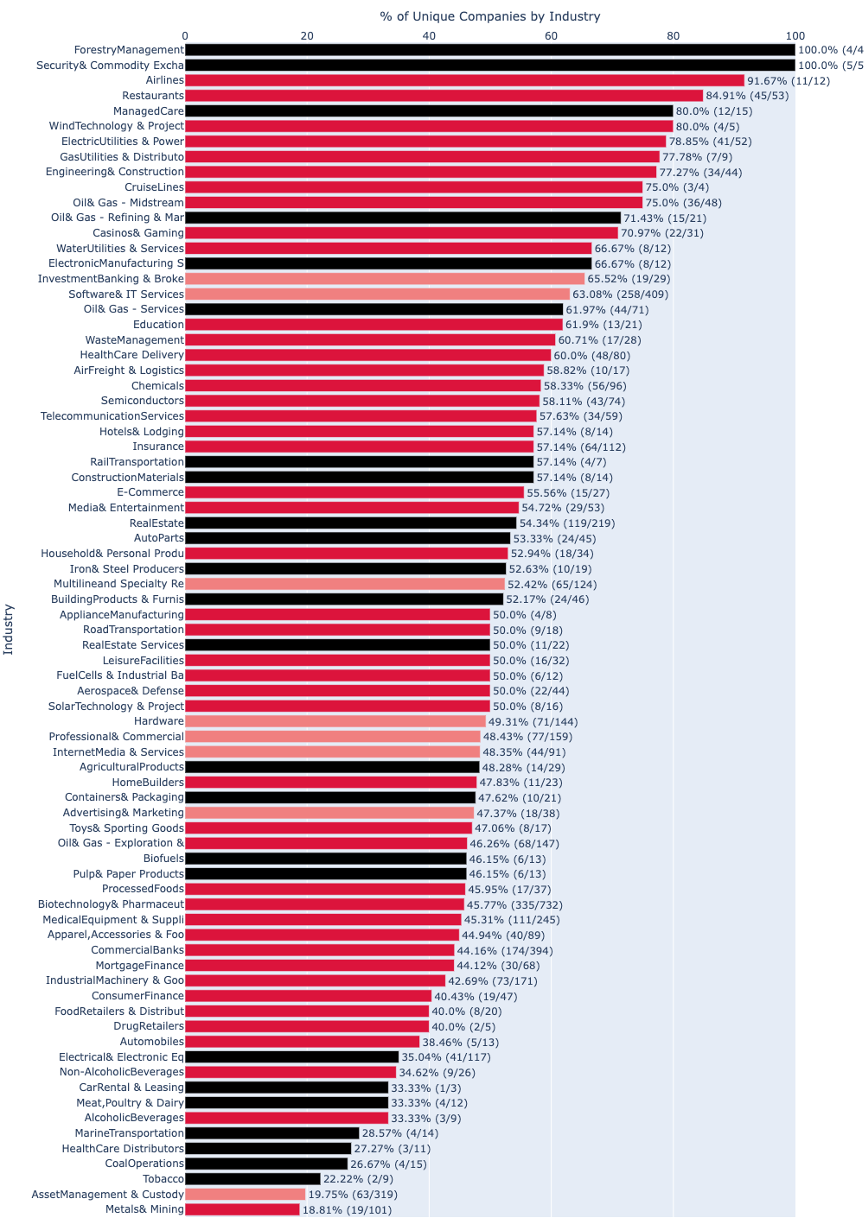
Figure 6: Industry shares of U.S. companies with financially material DEI events. Source: Form 10-Ks, Jan. 2016–Mar. 2021.
Thirteen of the 24 industries exceed this benchmark and should be considered for standard-setting:
-
- Forestry Management
- Security & Commodity Exchange
- Managed Care
- Oil & Gas—Refining & Marketing
- Electronic Manufacturing Services & Original Design Manufacturing
- Oil & Gas—Services
- Rail Transportation
- Construction Materials
- Real Estate
- Auto Parts
- Iron & Steel Producers
- Building Products & Furnishings
- Real Estate Services
Again, the ubiquity criterion captures all sizes of industries: the 13 industries exceeding this criterion have a count of companies self-reporting DEI risks on as many as 219 companies (Real Estate) and as few as four companies (Forestry Management). It is particularly noteworthy that two of these industries — Forestry Management and Security & Commodity Exchange — have a ubiquity measure of 100%.
Our two data sources corroborate each other in terms of ubiquity measures that exceed the benchmark for four industries (see Figure 7):
-
- Building Products & Furnishings
- Oil & Gas Services
- Rail Transportation
- Security & Commodity Exchange
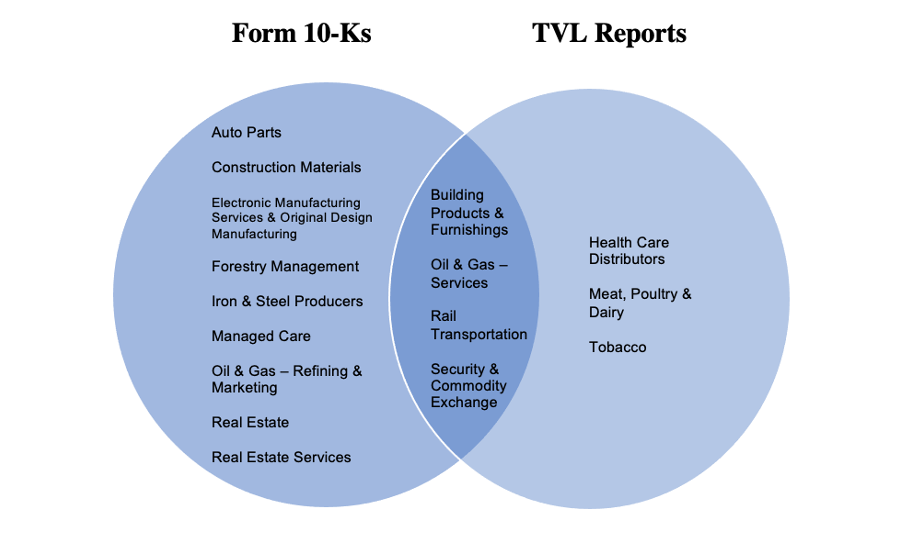
Figure 7: Non-proposed Industries for which DEI is material, as identified in Form 10-Ks and TVL reports.
Form 10-Ks reveal evidence supporting the extension of the DEI topic to nine further industries that have not been flagged in TVL. This difference is likely due to how we apply the heuristic to each source. With our TVL corpus, we find co-occurrences of a DEI-related company practice and a risk/opportunity. With Form 10-Ks, it is not necessary to identify co-occurrences since any issue mentioned is by definition financially material to the reporting company. Therefore, we search only for the presence of a DEI-related practice term or a company risk/opportunity term related to worker protest or modern slavery, as these may indicate company awareness that the practice is DEI-related. As we continue to improve our risk/opportunity term dictionary and expand it for the four channels of business relevance, we expect to find more co-occurrences within TVL.
Addition Workstream: Preliminary Findings
For our Addition Workstream, we identify potential new metrics by leveraging our heuristic method, term dictionaries, and datasets to identify relationships between DEI practices and risks/opportunities by industry. To get a sense of the frequency of these mentions, we started by counting the number of companies per industry involved in a financially material event related to a DEI practice. Our DEI context terms — standalone terms, such as “discrimination” and “harassment” or demographic-specific terms — enable us to analyze these relationships for specific marginalized groups. (See the February 2022 Update for more on DEI context terms.)
In this section, we provide a ranking of the DEI company practices linked to a financially material outcome across all industries. We first describe our results in applying our methods to TVL reports, and then to Form 10-Ks. In doing so, we are working towards using our co-occurrence search results to benchmark mentions of material DEI practices by industry to inform DEI standards revision.
The full list of practice terms that we ran can be found in Appendix A. Table 2 provides a sample of the list, containing the terms and their patterns found via co-occurrence search (known as regular expressions in natural language processing). These terms are referred to in the discussion that follows.
Table 2: Company Practices and Patterns

Material DEI practices surfaced from TVL reports
For our first look at the data using our DEI keyword dictionary, we examined the company counts of material DEI practices by industry. We found that 16 unique companies from the Media & Entertainment industry, for example, are linked to a financially material risk/opportunity due to practices that result in work environments hostile to certain marginalized groups. Within this set of reports, we found DEI context terms such as “sexual,” “gender,” “race,” and “age.” We recognize ambiguity around the term “sexual,” which could imply sexual harassment or sexual orientation, and have flagged this for further study.
Table 3 lists the 15 most prevalent financially material DEI practices in industries with the highest company counts connected to the practice. All 77 industries are included, and figures are based on the number of companies implicated in TVL reports. The column for DEI context terms shows the groups (e.g., gender-M/F, disability, race, age) that appear in these articles, providing insight into the type of issue or marginalized group involved in the material practice and outcome.
Table 3: The 15 Most Prevalent Financially Material DEI Practices (by Industry)
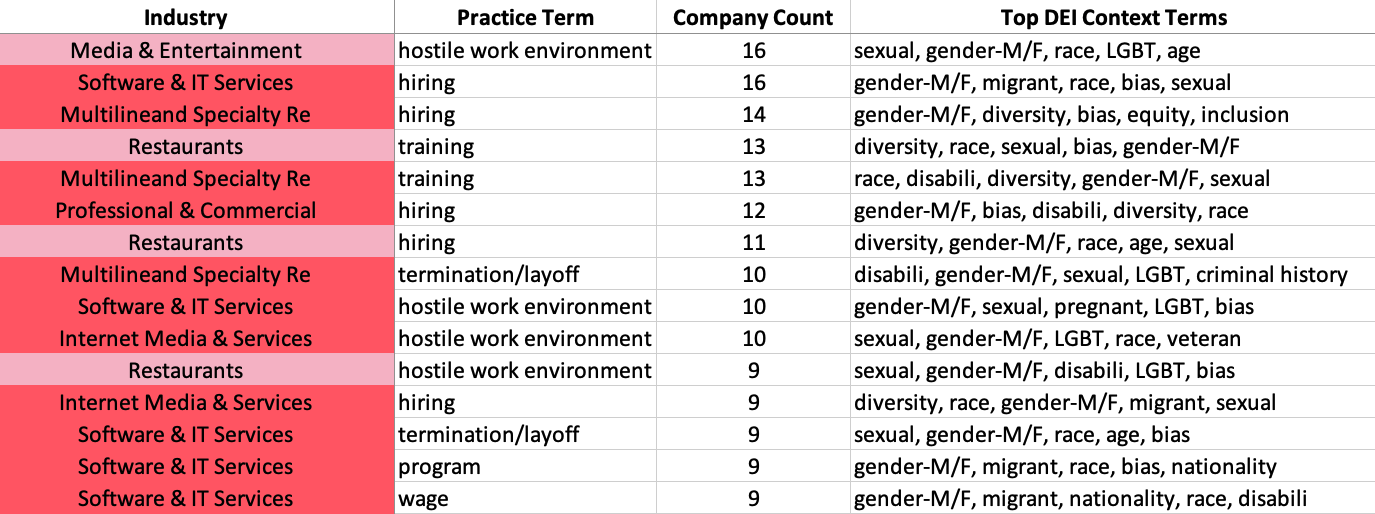
We observe these counts to understand the most widespread practices covered in TVL reports. We can see that hiring practices (flagged by keywords such as “hire,” “hiring,” “eligib,” “equal employment opportunit”) are frequently covered in TVL reports with company counts for the following industries among the highest:
-
- Software & IT Services (16)
- Multiline and Specialty Retailers & Distributors (14)
- Professional & Commercial Services (12)
- Restaurants (11)
- Internet Media & Services (9)
Hostile work environments (flagged by keywords such as “toxic/hostile workplace,” “working conditions,” “dangerous,” “unsafe”), on the other hand, are linked to material outcomes for companies in four industries:
-
- Media & Entertainment (16)
- Software & IT Services (10)
- Internet Media & Services (10)
- Restaurants (9)
See Appendix B for the complete output of Table 3.
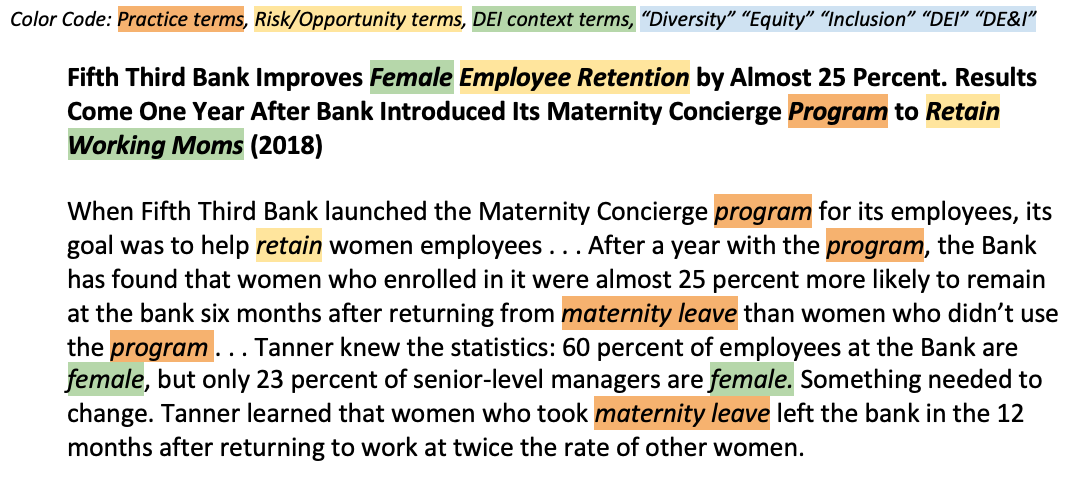
The following example demonstrates the variety of practices that result in hostile work environments in Media & Entertainment (Julia Hunt, “Ellen DeGeneres apologises to staff amid toxic workplace allegations,” Yahoo! Finance UK and Ireland, July 31, 2020, http://ct.moreover.com/?a=42733953363&p=4la&v=1&x=xzztqtuUSVDhV2-kVfix5A):
Ellen DeGeneres apologizes to staff amid toxic workplace allegations (2020)
DeGeneres has apologized to staff amid allegations of a toxic work environment on her talk show . . . A number of staff from the daytime program recently spoke out anonymously to Buzzfeed claiming they had experienced intimidation and racism working on the show, and it was reported that WarnerMedia launched an internal investigation in response . . . The allegations included employees being fired after taking medical leave or bereavement days, facing microaggressions and a culture of bullying and favoritism by executive producers .
We can see from this example that anonymity of worker/employment complaints processes is a material issue in this instance. Therefore, DEI metrics may ask companies to provide a qualitative discussion of measures in place for employees to report anonymously. Alternatively, a metric may ask companies for a quantitative metric to describe the frequency of anonymous employee complaints specifically related to unsafe workplace behavior.
The term “program” can refer to one of the many different kinds of programs that companies implement, such as community outreach, employee support, or talent attraction programs, to support DEI in their workplaces. As we extend our heuristic method to the four channels of DEI business relevance, we will add indicators that distinguish contextual variations in such terms.
One example of such a program, as found in the Commercial Banks industry, is described in the following report excerpt (“Fifth Third Bank Improves Female Employee Retention by Almost 25 Percent,” Business Wire, June 11, 2018, https://www.businesswire.com/news/home/20180611005115/en/Fifth-Third-Bank-Improves-Female-Employee-Retention-by-Almost-25-Percent):
TVL findings provide valuable information regarding what practices trigger financially material DEI events for companies domiciled in different jurisdictions, and in this way are a useful complement to our Form 10-Ks. See Appendix C for examples of financially material DEI events by country.
DEI practices reported in Form 10-Ks
Turning to results from Form 10-Ks, Table 4 lists the industries with the most mentions of specific DEI corporate practices.
Table 4: Form 10-K Company Counts Linked to Specific DEI Practices (by Industry)
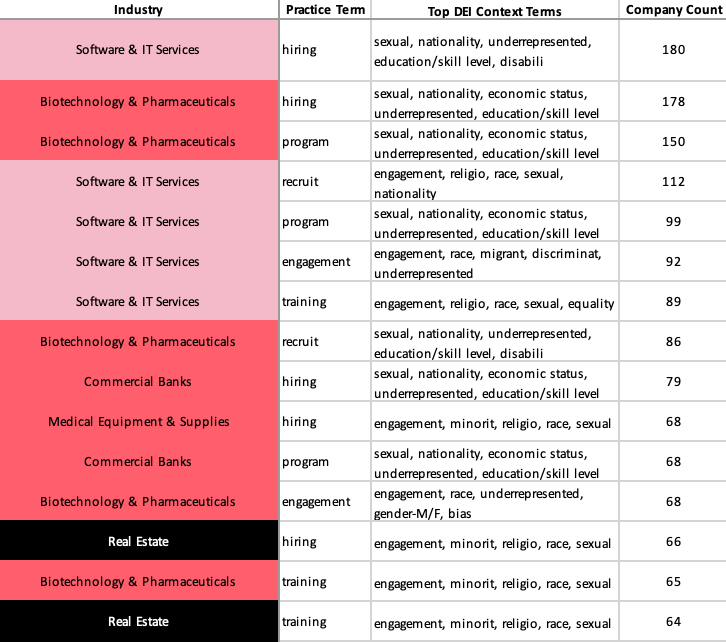
We can see that, in Form 10-Ks, hiring practices are discussed most frequently in the following industries:
-
- Software & IT Services (existing SASB Standard for DEI)
- Biotechnology and Pharmaceuticals (proposed for DEI standard-setting)
- Commercial Banks (proposed for DEI standard-setting)
- Medical Equipment & Supplies (proposed for DEI standard-setting)
- Real Estate (no existing/proposed topic for DEI standard-setting)
Two other prevalent practices that appear in Form 10-Ks are employee training and engagement, which appear frequently in the Software & IT Services, Real Estate, and Biotechnology & Pharmaceuticals industries. In comparison to Form 10-Ks, TVL reports cover employee training for four companies in Software & IT Services, one company in Real Estate, and no companies in Biotechnology & Pharmaceuticals. The industries for which TVL reports cover employee training most frequently (from at least five companies) are as follows (see Appendix B):
-
- Restaurants (13)
- Multiline and Specialty Retailers & Distributors (13)
- Apparel, Accessories & Footwear (7)
- Professional & Commercial Services (5)
In Form 10-Ks, we find that the term “program” is mentioned alongside the DEI context terms and term categories “sexual,” “nationality,” “economic status,” “underrepresented,” and “education/skill level” for Biotechnology & Pharmaceuticals, Software & IT Services, and Commercial Banks. This finding suggests that companies in these industries have created programs to promote inclusivity in their workforces. TVL also surfaced material events related to DEI programs for 44 industries, with the most events surfaced from the Software & IT Services, Commercial Banks, and Telecommunication Services industries (Appendix B).
The following excerpt from Verisign, Inc.’s 2021 Form 10-K describes how Software & IT Services companies are self-reporting about how they foster engagement and support workers through employee training programs:
When observing the industries with the highest company counts connected to a given material DEI practice, TVL reports and Form 10-Ks corroborate each other in identifying industries linked to three practices — hiring practices, employee training, and DEI-focused programs — with high frequencies. Our keyword dictionaries uncovered some differentiation in the top material DEI practices by industry between TVL reports and Form 10-Ks. While some practices appear in Form 10-Ks with higher frequency than TVL, we are paying close attention to TVL third-party reporting of material events that companies do not self-report. These practices include reprisal/retaliation, worker terminations/layoffs, and wages.
Next Steps
In this update, we reported on the evidence of financial materiality by industry that surfaced using our heuristic method across two data sources, with 90% accuracy. For the Extension Workstream, we used a classification of existing industries, industries SASB researchers have proposed for standard-setting, and non-proposed industries to create a benchmark standard that can be used to develop a case for further extending DEI standard-setting. We uncovered evidence in TVL reports and Form 10-Ks to support the extension of DEI standards to a total of 16 industries of the 24 not yet proposed. Applying our co-occurrence method to TVL reports provides valuable information regarding what practices triggered financially material DEI events on a global scale.
We also provide preliminary insights regarding the most frequently covered (TVL) or self-reported (Form 10-Ks) DEI practices that are financially material to companies in their industries. As we continue iterating our heuristic method and expanding our keyword dictionary, we can improve our capability to identify company DEI practices that better capture material opportunities resulting from good DEI practice, alongside the further identification of negative practices resulting in enterprise risk. We are expanding our data sources to include foreign company filings in the U.S. (Form 20-Fs) and in other jurisdictions, particularly those that maintain an EDGAR-like database of filings, such as Korea and Canada. To better understand trends in investor interest, we are working on applying our methods to proxy statements as well as earnings calls.
Through these means, we can hone in on material DEI practices by industry and assess the characteristics of those linked industries to test the four channels of business relevance. In turn, we are using VRF’s Channels of Business Relevance rubric to expand our keyword dictionary to improve our visibility into material DEI practices across industries.
Appendixes
Endnotes
1 “Human Capital: Diversity, Equity & Inclusion,” Value Reporting Foundation, 15 Dec. 2021, https://www.sasb.org/standards/process/active-projects/human-capital-diversity-equity-inclusion/&sa=D&source=docs&ust=1650421235732793&usg=AOvVaw1TznhVTVFWT1_fubS1mUdD
2 Marc Siegel, “A new Sustainability Accounting Standards Board Project addresses potential DEI disclosures and how they vary by industry,” EY, 10 Feb. 2022, https://www.ey.com/en_us/assurance/diversity-equity-and-inclusion-dei-the-industry-perspective
3 “Sustainability Accounting Standards Board Public Standards Board Meeting,” Value Reporting Foundation, 15 Dec. 2021, https://www.sasb.org/wp-content/uploads/2021/12/2021Q4PublicMasterDeck_Watermark.pdf, p. 36.
4 Ibid, p. 43.
5 The wording of the metric as it appears in the SASB Standard is “Percentage of gender and racial/ethnic group representation for executive management, non-executive management, professionals, technical staff, and all other employees.” See “Human Capital: Diversity, Equity & Inclusion,” Value Reporting Foundation, 15 Dec. 2021, https://www.sasb.org/wp-content/uploads/2020/12/HumanCapitalBulletin-112320.pdf, p. 8.
6 “At a Glance: TruValue Labs SASB Spotlight Datafeed,” Factset, Sep. 2021, https://insight.factset.com/resources/at-a-glance-truvalue-labs-sasb-spotlight-datafeed%23:~:text%3DThe%2520Truvalue%2520Labs%2520SASB%2520Spotlight,from%2520over%2520100%252C000%2520different%2520sources&sa=D&source=docs&ust=1650481263592105&usg=AOvVaw0xEtTBa9xDHePy9FHzg1U
7 “SEC Adopts Amendments to Modernize Disclosures of Businesses, Legal Proceedings, and Risk Factors Under Regulation S-K,” United States Securities & Exchange Commission, 26 Aug. 2020, https://www.sec.gov/news/press-release/2020-192
8 Ibid.
9 Emily Bonta, Catrina Notari, Alison Omens, Aleksandra Radeva, Ian Sanders, Kavya Vaghul, “The Current State of Human Capital Disclosure in Corporate America: Assessing What Data Large U.S. Employers Share,” JUST Capital https://justcapital.com/reports/the-current-state-of-human-capital-disclosure-in-corporate-america/
Photo by Michael Dziedzic on Unsplash